Your Wind Rose view provides a clear visual summary of wind behaviour over a selected time period, showing both the prevailing wind direction and the frequency of wind run or speed. Using accurate, calibrated data from your Skyview monitoring system, this data allows you to understand how often and how strongly the wind has blown from each direction, supporting confident, informed decision-making for site safety and operational planning.
Time and Date:
Here you can access specific data from your desired time frame. Choose the dates and times you would like the report to display from.
Mode:
Here you can access both wind run and wind speed frequency graphical reports. Simply click the data type you would like to view. The mode highlighted in blue will correlate to the data displayed on the graph.
Wind Speed Frequency:
Each colour represents a speed reading band, allowing you to see how strong the winds were in that time period. The relavant colour bands will display on the graph above in wind speed frequency mode.

Wind Blowing Direction:
Here you can access accurate wind direction data and view where wind has come from and where it has blown towards. Again, simply toggle between the two states and the graph will update accordingly.
The longer the bar, the higher the wind frequency has been recorded.
Map Overlay:
The map overlay functionality displays the graph with and without the location parameters.
Again, simply toggle between the two states and the graph will update accordingly.
Accessing historical Wind Rose reports
You can access Wind run and wind speed frequency data in a few simple steps.
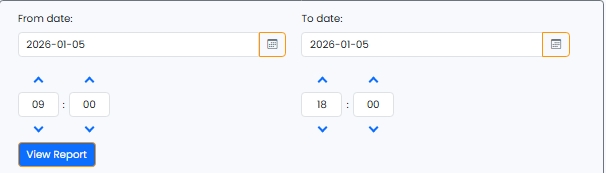
Select the date range you require using the From and To fields on the right-hand side of your page.
Below, choose the desired specific time you would like to access from the start and end dates.
Click View Report
Your table should update to display the relevant data collected within your specified date and time range.
Ensure you have chosen all the desired modes and data types below before updating your report.