View your historical monthly and annual reports in a clear, structured table format. This page brings together key site metrics including wind speed averages and maximums, peak wind timing, wind direction averages, and rainfall totals. With flexible date selection and export to CSV functionality, you can quickly review long-term performance, support reporting requirements, and share accurate, time-stamped data with ease.
Choose Your Report:
At the top of the page, you can select the timeframe for your report using the dropdown menu. Options include viewing data for the current month, specific month/year, or generating a report for the entire year of your choice. The table will automatically update based on your selection, ensuring you always see the correct dataset for your chosen period.
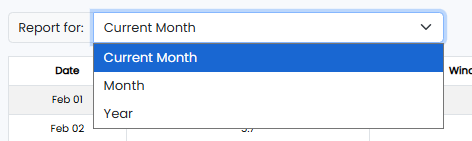

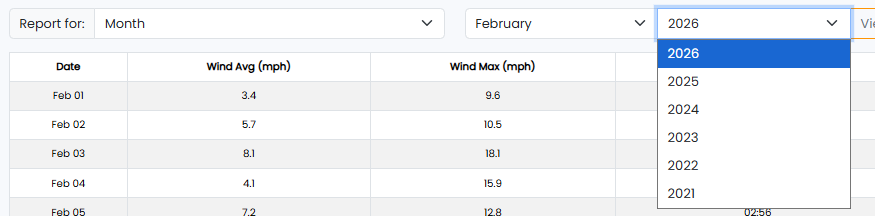
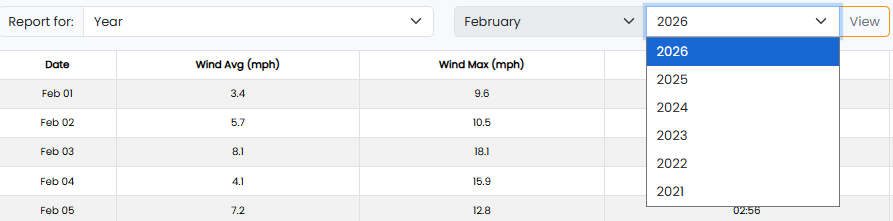
Table:
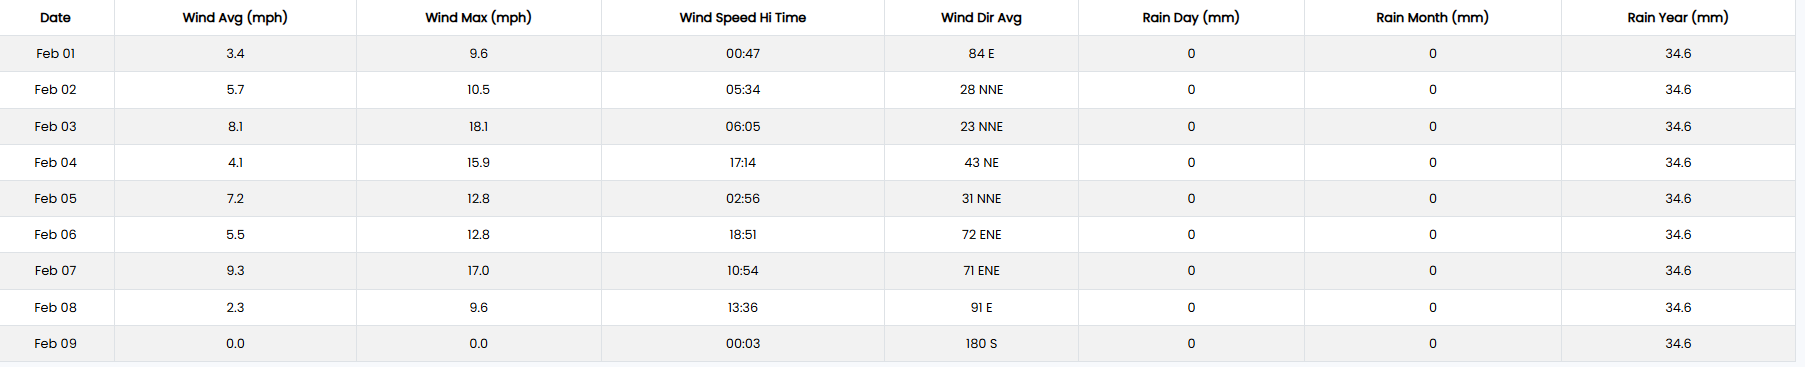
Here you can see all your data in an organised table format that includes the date ranges you selected, wind average and max speeds, wind direction, and rainfall readings for day, month, and year.
Exporting Historical Monthly and Annual Reports
You can export your reports in a few simple steps.
Select the date range you require using the “Report for” right-hand side of your page. Your table should update to display the relevant data collected within your specified date range.
Click Export to csv and you will find the downloaded csv file as shown in the clip below: