The Live Data page provides an at-a-glance view of current weather and site conditions, displaying precise real-time readings from your Skyview monitoring system. Each module updates automatically, allowing you to track environmental changes and make informed decisions based on accurate, calibrated data.
Interactive Map
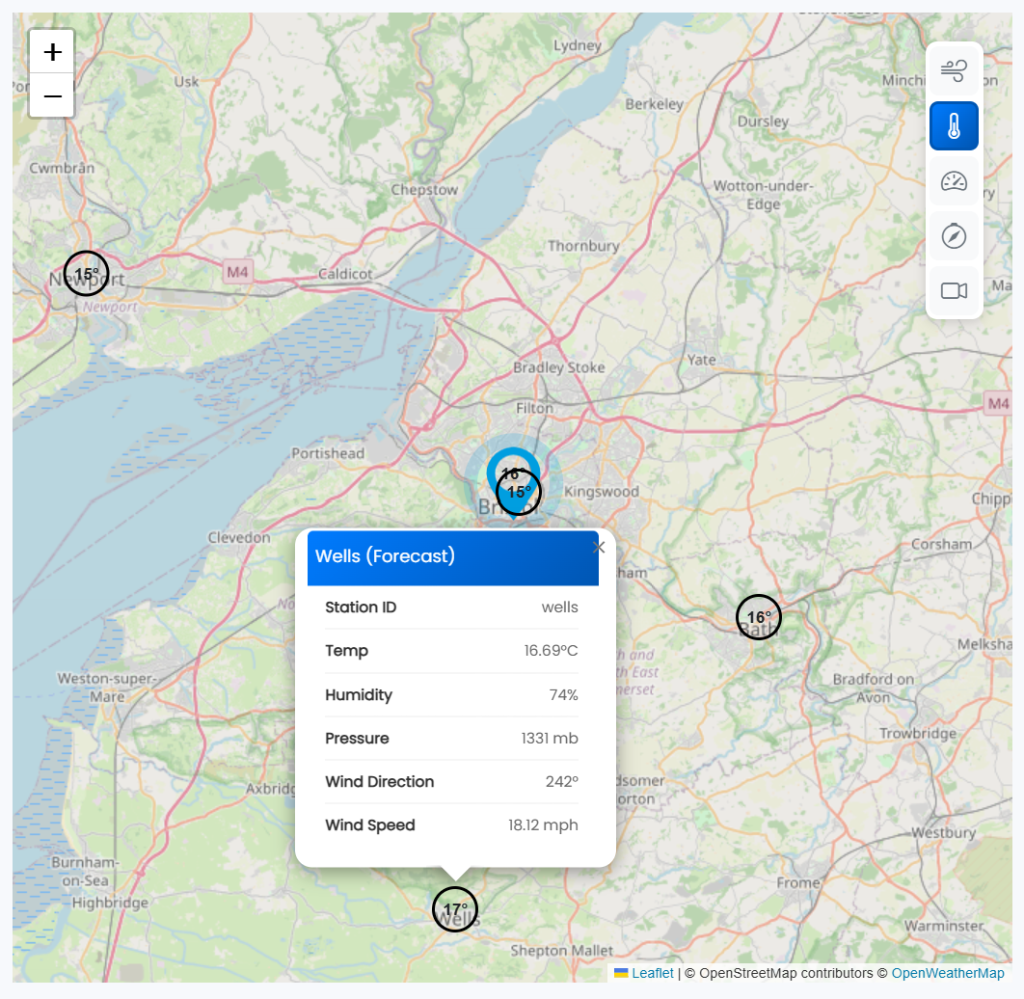
Displays your selected site location with live data overlays.
New for V3, the interactive map now includes accurate forecast data powered by OpenWeather. Click on your site location dropper for your own Live Weather Data or click on a local town for up-to-date forecast information.
Offers zoom and pan functions for quick navigation between sites.
Shows the geographical position of each monitoring station.
Provides visual layers such as temperature, wind conditions, current weather and more.
Wind
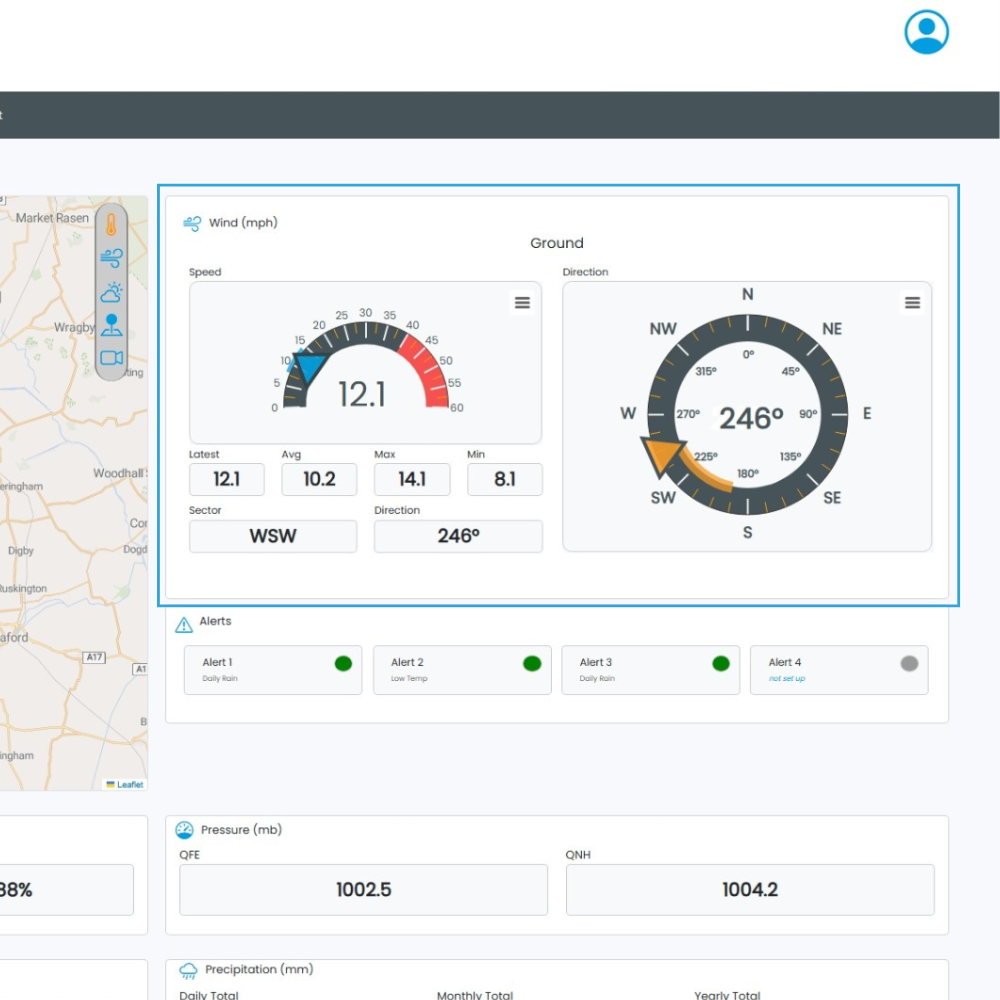
Real-time wind monitoring, shown as both speed and direction.
Includes a directional dial to illustrate wind bearing and variability.
Displays live, average, maximum, and minimum speeds.
Alarms & Alerts
Live Data Modules Overview
The Live Data section displays key environmental readings in real time, grouped into core data modules for faster interpretation and cleaner visual access. Each module updates automatically, ensuring that site and weather information is always accurate and up to date.
Atmospheric Conditions
View live temperature, humidity, and pressure data. These readings include outside temperature, dew point, and both QFE and QNH pressure values. This information is essential for assessing local air quality, stability, and environmental conditions.
Forecast & Precipitation
Access short-term forecasts and rainfall totals to support daily planning and compliance reporting. The forecast module shows upcoming weather patterns, while the precipitation summary provides daily, monthly, and yearly totals.
3-Hour Forecast
New for V3, this functionality provides an accessible drop-down list view of each 3-hour forecast throughout the day, displaying parameters such as temperature, wind, pressure, humidity, clouds and visibility.
Soil Conditions
Monitor soil moisture and soil temperature across multiple depths to understand ground behaviour and surface stability. These modules support environmental safety, construction oversight, and agricultural monitoring.
Solar & UV
Displays real-time solar radiation and UV index levels, helping teams manage site exposure and assess energy or safety impacts.
Tabbed Graphs
The tabbed graph interface in Skylink-Pro brings all your critical weather parameters together in one intelligent, easy-to-navigate view. Users can move seamlessly between temperature, humidity, wind speed, wind direction, pressure, rainfall, and solar radiation, accessing calibrated, real-time insight without switching screens or losing context.
This streamlined experience is designed to support faster, more confident decision-making, giving teams a dependable understanding of changing conditions at a glance. By presenting complex environmental data through clear, intuitive visualisations, the tabbed graphs reinforce Skylink-Pro’s role as a reliable, specialist tool that strengthens site safety, enhances compliance, and provides the operational clarity organisations depend on.