Skylink-Pro’s Ground Monitoring dashboard is suitable for users with a rain gauge, UV, and or Solar sensor or a soil moisture thermometer station. Providing a clear, structured space for essential ground conditions and evapotranspiration calculations this module is an invaluable supporting tool for a number of industry sectors.
Date Range Filter:
As with many other reports within Skylink-Pro, the ground monitoring report utilises a date range filter. This enables users to review historical trends and assess environmental conditions over specific timeframes. This supports evidence-based decision-making and compliance reporting.
Soil Conditions:
This section provides detailed insight into ground-level environmental performance, essential for site safety, turf management, and operational planning.
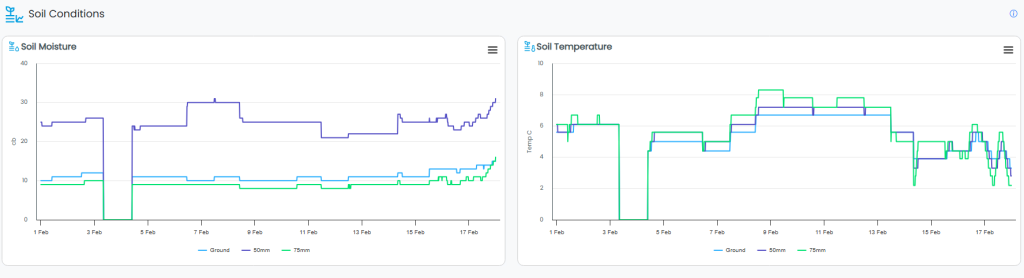
Soil Conditions is broken down into soil moisture and soil temperature. “Soil Moisture” displays soil moisture levels at multiple depths over time, while “Soil Temperature” displays soil temperature variations at different depths, both associated with the defined dates selected within the filter.
Precipitation Summary Block:
Displays aggregated rainfall totals grouped to daily, monthly and yearly totals.
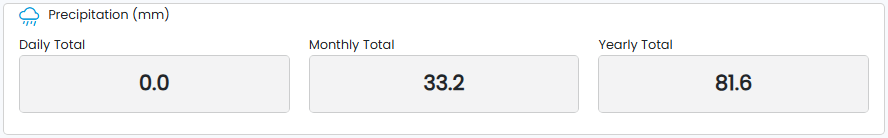
Provides quick-reference rainfall statistics to support reporting, compliance checks, and water management planning.
Rainfall Today & Rainfall This Week
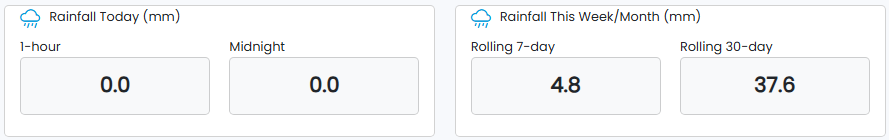
Rainfall today enables immediate awareness of developing weather conditions. Supports operational decisions such as event management or ground safety checks. Rainfall this week offers contextual insight into recent weather patterns, supporting planning decisions and ground condition forecasting.
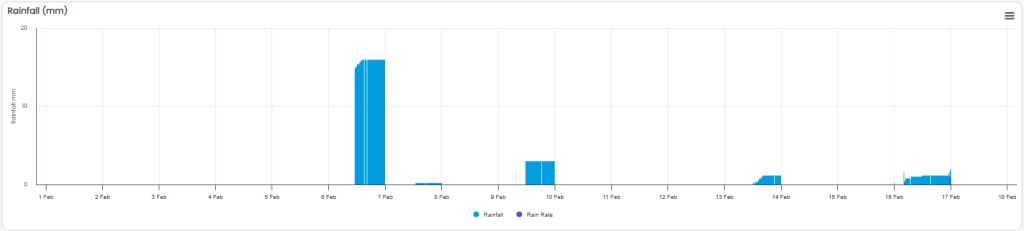
Rainfall Graph:
Visual representation of rainfall events over time. Allows users to identify intensity, duration, and clustering of rainfall events. This supports drainage performance evaluation and site risk mitigation.
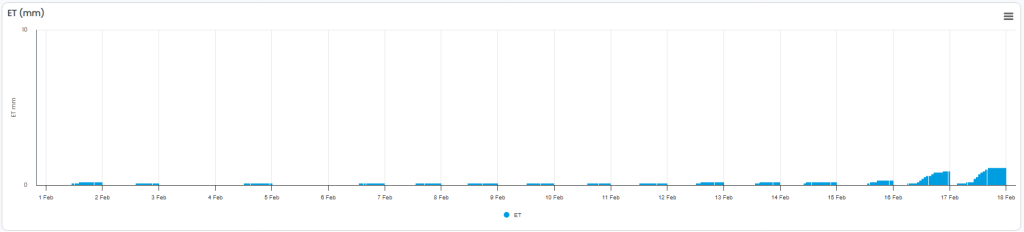
ET Data Summary:
Displays evapotranspiration totals. Supports water balance assessment by showing moisture loss due to evaporation and plant transpiration. Essential for irrigation planning and long-term environmental management.

ET Graph:
Provides insight into drying conditions and moisture demand. Supports intelligent, data-led ground management decisions.