The Site History (Graphical) page provides a clear overview of your site’s past environmental conditions, featuring dynamic graphs for wind speed, rainfall, and wind direction. These interactive charts let you explore trends over time, with tools such as full-screen view, zoom, 12-hour data display, and an expandable data picker. All datasets are automatically recorded and organised, allowing you to analyse patterns, review past events, and make informed decisions based on accurate, time-stamped data.
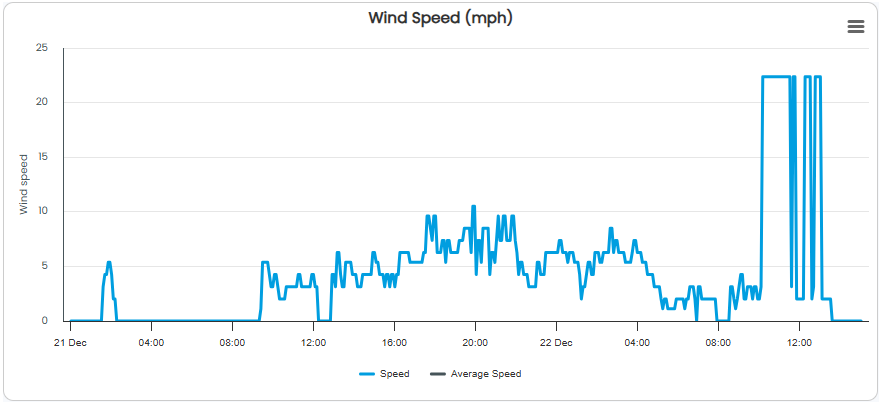
Wind Speed Graph
Shows how wind speed has changed over time.
Highlights periods of high and low wind activity.
Shows the geographical position of each monitoring station.
Supports informed decisions with accurate, time-stamped data.
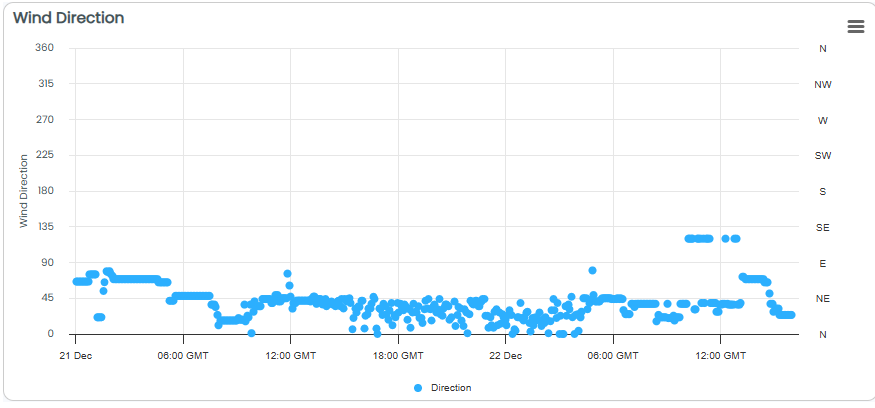
Wind Direction Graph
Shows how wind direction changes
Makes prevailing wind patterns easy to identify
Interactive charts.
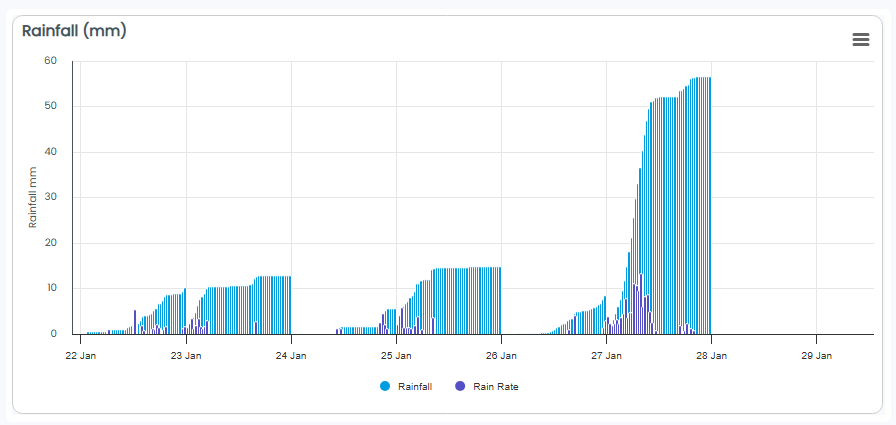
Rainfall Graph
Displays your selected site location with live data overlays.
Offers zoom and pan functions for quick navigation between sites.
Shows the geographical position of each monitoring station.
Provides visual layers such as temperature, wind conditions, current weather and more.
Viewing your Data on Full Screen
You can now view your site history data in full screen, giving you more space to explore graphs and analyse trends in greater detail. This new feature makes it easier to focus on specific data points and patterns without distractions. Watch the screen recording below to see how quickly and easily you can expand any chart to full screen.
Printing Your Data
Easily print your site history data directly from the graphical page, creating clear, shareable records of your data and reports. This feature ensures your data is presented in a clean, readable format for offline review or documentation. Watch the screen recording below to see how simple it is to print your data.